Graph editor and Matrix generator
Making matrix representations of graphs always takes a lot of time. For practicing algebraic or spectral graph theory on computer algebra systems, one has to create a lot of graphs. A handy tool can make this easy, which allows to draw graphs and generate code e.g. for Maple with one click. Well I couldn’t find a tool like that, so I made one on the weekend in C#.
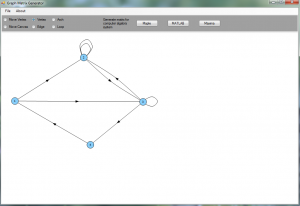
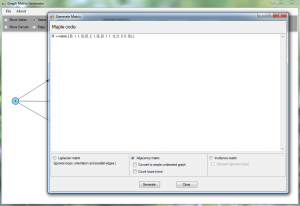
With it, you can draw custom graphs, including: arbitrary loops, parallel edges, directed edges, etc. and can generate code for these computer algebra systems: Maple, MATLAB, Maxima. Then the code can be used immediately after a copy-paste.
You can download the program here:
- GraphMatrixGenerator.zip (made in C#, requires .NET 3.5)
Screenshots
Click on the images to enlarge.
Usage
- Vertices: select “Vertex” mode. Click on the canvas to create one, right-click on a vertex to remove it.
- Edges / archs: select “Edge” or “Arch” mode. Click on a vertex to select it, then click on a second vertex to draw an edge or an arch. To remove edges/archs, just right-click on the second vertex.
- Loops: select “Loop” mode. Click on a vertex, and keep the left button pressed, and move it to set the direction of the the loops, then release it. You can add multiple loops. Right-click to remove a loop.
- Moving vertices or the canvas. Select the proper mode, click on a vertex or on the canvas, and move the pointer before you release it.
An example for spectral graph theory
This example is made for the Maxima system, which is a free, open source software, so anybody can download and use it.
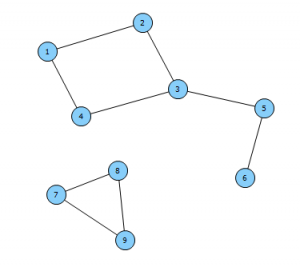
I’ve drawn this simple, unconnected, undirected graph: (click to enlarge)
And generated a laplacian matrix for Maxima:
m: matrix (
[2, -1, 0, -1, 0, 0, 0, 0, 0], [-1, 2, -1, 0, 0, 0, 0, 0, 0],
[0, -1, 3, -1, -1, 0, 0, 0, 0], [-1, 0, -1, 2, 0, 0, 0, 0, 0],
[0, 0, -1, 0, 2, -1, 0, 0, 0], [0, 0, 0, 0, -1, 1, 0, 0, 0],
[0, 0, 0, 0, 0, 0, 2, -1, -1], [0, 0, 0, 0, 0, 0, -1, 2, -1],
[0, 0, 0, 0, 0, 0, -1, -1, 2]);
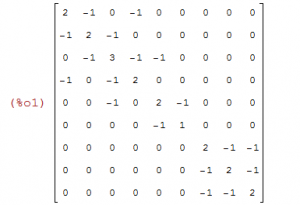
Copy this text into Maxima and then press SHIFT-ENTER. It will display the matrix:
Now let`s calculate the eigenvalues of the matrix, to get the spectrum of the graph, by:
float(eigenvalues(m));
The response is (after a shift-enter):
[[0.43844718719117, 4.561552812808831, 2.0, 3.0, 0.0],[1.0, 1.0, 2.0, 3.0, 2.0]]
We got two lists. The first contains the unique eigenvalues, and the second shows how many we have of them. So the full and ordered list of eigenvalues is:
0, 0, 0.43844718719117, 2, 2, 3, 3, 3, 4.561552812808831
The second smallest eigenvalue is called the algebraic connectivity, if it’s zero, it means that the graph is not connected, which is true.


